


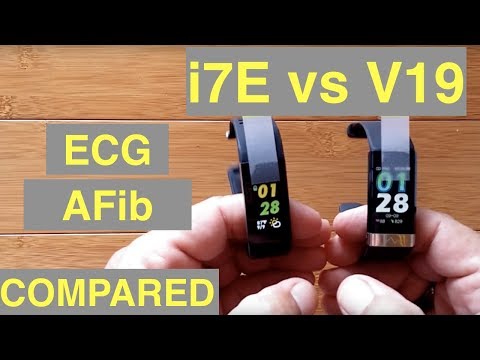
Com. You have seen the reviews of the i7 II and the V 19, and now you want to know which one of these awesome amazing, new technology devices. You should buy I'm going to go through that with you in just a second after I mentioned that both of these incredible bands are available at a deep discount under 30 bucks considerably. Now. First of all, the i7e, the ALF wise watch is from gearbest and the baekje v 19 is from banggood got buying links for you in the show notes down below. Please use those links, it'll help us all out and get you these bands really quick so which is which in which do you need? Well. Obviously, you can see that this has got a bigger flatter display they're, both about the same brightness they'll, be equally visible outdoors. They have different watch faces, you can put on them, but this is kind of the sharpest one that I could find. That gives you just the basic time and information. They both do. Ecg that's, electrocardiogram that's, your heart wave chart this one. Does it simply by wearing it and putting a finger here when you're in the ECG mode, the opposite hand has to press that button and when you do it'll start recording that information for you, this one's a little bit different, you wear this one and that electrodes Are on the sides so, with this one on you hold both sides with the opposite hand, like this, just a subtle difference, but they both seem to work really really well now, depending on what your medical situation is, there could be different reasons for getting each of These this particular one, the v 19 works well with sleep, apnea and those kinds of issues.
If you have them, this might be something to consider this one has got a lot of detail on the scatterplot that you learned about. If you don't know what I'm talking about go back and watch both of these reviews, there's deep detail on different conditions that could appear in the scatter plots, the diagrams that you get from wearing it. This uses the same scatter plot technology and it shows a little bit different distribution of the normal scatter plot, but doesn't go into as much detail as this one does, but that's just information, and you can get that from watching these reviews. As far as producing the scatter plots on a daily basis, both of them work the same. They start at midnight. They acquire the data throughout the night into the morning and then they keep all that data in here until you tear it to the app and the app is where you see your scattered scatter plot, so we're gon na look at those in just a minute. Let'S, do a quick run through I'm gon na move this up a little bit easier to see the screen so keeping these tags on. So you can keep them straight this one. You touch the screen and you slide the screen it's a little tricky on what you do win there. I touched it there. I slide it and you can see step stuff, and then you have to hit a back arrow little bit.
Learning curve on how you get into things here, they're in big categories and then subcategories underneath all of that, but they twirl through, like that back to here this one it's, a one button Pony you just press or you press and hold there's the first page. Here you have all your data on step count. Then you can go in if you long press it, you can get your heart rate, blood pressure and so forth. Sleep times from the night before blood oxygen on here as well long press to start a run and that's all it'll do is run. Then the ECG information and stop watching you back to turning it off and back here. If you workout get the i7e it's much better performance wise in terms of the activities that you can do for workout and it's set up so once you put your age and information in it, you'll be able to have to get in here there we go there's, A run there's, a cycling and so forth. Once you put your birthday age and height and all's gender, all that kind of stuff in here you'll be able to start an event like this, and it can track your heart rate and it will prompt you if you're moving too slow – and I presume too fast. It has the flashing light going on down here that you just look at the color of the light and you'll know what heart zone you're in this is tremendous.
If you are active, this is great. If you're sedentary, you don't need all that kind of stuff. The only thing this does, like I mentioned when you're in a run, which is the only thing it can support right here, long press, it uses the pedometer inside to get you your step. Count and it'll give you your heart rate versus time versus steps, distance and calories, but none of this other exotic capabilities that you see for exercise workout in a variety of different things, including swimming sedentary or light exercise not really into that the V 19's. Fine, the i 70. Definitely if you are active if you're, sedentary and plan on becoming active. This is a good one to coax you into it. It'S not gon na hard push. You you're not gon na challenge yourself against other Olympiads in a in a competition but you're gon na you're gon na get there and you're gon na be able to see your results on it as well. So let's take a look at the apps and see the differences now I've got a folder. That'S got all kinds of different tethering apps for different kind of bands and watches that do ECG readings. We are specifically looking for the i7 e 40 nur, so you're gon na look for and load up 0 nur, and this is what you get you remember, seeing that and it's gon na synchronize up to this one, while it's doing that I'm also gon na switch.
You to this other one now I've got a folder that's got all kinds of different tethering apps for different kind of bands and watches that do ECG readings. We are specifically looking for the i 74 0 nur, so you're gon na look for and load up 0 nur, and this is what you get you remember, seeing that and it's gon na synchronize up to this, while it's doing that I'm also gon na switch you To this other one and it's called whoa, fit it so whoa fit what it loads up. Is the one that's going to tether here to our V 19. Now this one's a little trickier, sometimes it doesn't come up properly, so it's going to see other things that I've got here and then you have to go to where you see the V 19 select it it's, gon na, say connecting and eventually it's gon na come Up as well so we're gon na switch back now, this one should be connected I'm gon na go over and this says it's synchronizing data. So again, here you've got a lot of capability with running and cycling and stuff tracking. All of that, when it comes to sleep time, the i 70 is kind of light on that you get this basic information and you get an overall score now, if you don't, really care and analyze when you got up and went to the bathroom and those kind Of things this this is fine and just monitor the score, which is overwritten with that one talking to it right now I got an 88 on this one that's today you change the date, and there was 84 yesterday and before that 74 rise times sleep time, awake Time basic stuff, and then you can actually evaluate your sleep and it'll.
Give you a little bit of information on sleep quality analysis, not quite as robust as what you get when you use the whoa fit app with the V 19, and when we scroll down here to sleep, you see, it's got a whole lot more micro detail, like Just about every second of your night life, when you go in here now, you have a lot more information fell, asleep, woke up time. Wake time your quality is listed as normal. It is not giving you a number you can tap in here and slide along to see the exact time and duration of your specific thing. This is rapid eye movement, the top one, which is another level that you're getting of sleep information as well as light sleep and then down at the bottom. The purple is is deep, sleep you get all that stuff there. You get all this stuff here and then you get two proportions of sleep segments. How many times you woke up your sleep, falling efficiency and overall sleep efficiency. How long it takes you to fall back to sleep and then what I really love about! This app is more statistics, you got. You know your cumulative information over days and months and weeks and and yeah a very, very robust stuff and that's related to sleep. So if sleep is something that you're concerned about, then you've got a really good analysis here with the v19 and the capabilities on this one.
All right, let's, look at the next thing, while on the topic of sleep I'm gon na stick with this now and come down here to blood oxygen spo2. This is your overall analysis of your blood oxygen level, but check out the cards here. This is where I'm saying: if you've got sleep issues like sleep, apnea, hypoxia, sleep, active, cardiac load, these kind of things all show up in these little cards, of which any one of them you can go deeper and get the underlying data, and specifically the times that Things happened, sleep related stuff. The v19 is your baby. By contrast, now the i7e it doesn't even do blood oxygen at all and nothing about sleep apnea, but it does do this thing called fatigue index. Bad news is, I have a real hard time getting this one to work, I've gotten a couple of readings, and it just gives you a general score and it's calculated from your heart rate, variability the higher the score. The lower your fatigue is the more relaxed you are, so you have it, but it's, not all that usable, but it is available to you what you do have on the i7e that's, even more impressive, though, when you get here once again, I'm looking in the health And you see I've got heart rate, ECG atrial, fib, gout blood pressure fatigue and then I loop back again, but when you get out of this and you go to the next page, this is this whole meditation section and you're not going to find it related to The app at all this thing is really cool.
When you go into it, you find you have options to set up like free time, which is just free running a one minute test, a five minute test or a full 30 minute relaxation experience. I should call it and when you do this, it's going to first do an HRV test at the beginning, then it's gon na guide you through a breath cycle for the time that you select and then it's, going to come back and repeat that HRV test and At the end, it's going to give you a score and from that score, it's gon na tell you how effective your meditative practice is now it's, just showing you on here a symbol that's going up and down that you can breathe with, but you could do whatever Your meditative practice is and just set it for that duration and let it do its thing as long as you're wearing it. It'Ll do the pretest the period and the post test. You could be totally Zend out doing nothing whatever you do it and then come back and look at it and find out what the number is adjust your practice accordingly and the i7e can give you a sense of relaxation through a biofeedback mechanism of heart rate, variability Testing nice addition to this band, you don't see it in the app, but it is built into the the band itself. Those are the basic things we've covered now, the major stuff you may be watching don't, you just hate it when somebody does that they save it until the last.
What about the dog on a Feb plots? What about what about these things? The scatter plots tell me about it all right, we're gon na get scatter plots on both of these bands and they appear to be both the same thing so it's just kind of a way of whichever one you want to use you could you could make that Choice, independent, but I will go quickly over it. It'S covered in much more detail in the app a scatter plot or Lorenz scatter plot in this app related to this band. You see these examples of medical conditions that would result in these kind of scatter plot images, and we don't know what this is, but the doctors do. They spent all those years of learning to figure this stuff out. So what you're doing is letting your body become an ode to transmitting overnight data from your heart rate picked up by your wrist over to this app to generate night after night, one of these little charts, all of them different, some of them similar creating some sort Of a pattern, fortunately, mine seemed to follow the normal sinus rhythm, but that may not always be the case. You, your parents, your grandparents, your great grandparents, auntie's uncle's, all of the folks that are over 50. This would be wise to at least be monitoring and it's. As simple as just putting the thing on, okay in the i7e in the atrial fibrillation section is where you find these plots on the other one, the wolf it that was a zero and zeros yeah that one this is the wolf it one you're gon na go Into heart rate, variability, where you have this kind of a chart, that's showing you from midnight until you wake up your HRV as dots on a line.
I have no idea how to read that, but I presume somebody knows anyway, it looks really pretty right get to it down here. Lorenz scatter diagram same as the scatter plots here. It looks like this. You get a different plot every day and it follows kind of this axis, but it could go off in all different ways, similar to what you saw from the results from this one. But we don't have a description of that, but we do have in the other app or right here on this video. You can go back and look at them. They talked about the different forms that this scatter plot could take. It could look like comet, which is sort of what mine looks like right there and that's normal sinus rhythm. It could be a rocket, no idea what it means, but your doctor should know, or all these other names they given at forecasts of rice torpedo. Oh okay, you touch it. It tells you what it is very short and small, basically consistent head and tail like rice, common among patients with arrhythmia Pvt. In most cases, oh cool it didn't accidentally touched it there's a torpedo, and it shows you again what that could. Possibly mean you're not doing self diagnosis here: okay, you're just collecting information and providing that to your doctor, so that your doctor can assess if you need any further on testing or medicine or whatever, okay. So a lot of that information is in here now, unfortunately, on most of these apps, when you download them, unless you are actually tethered to a band that can produce ECGs or HRVs, or any of that, you don't actually get to look at all of this stuff, Which is why it's nice to be able to see it on an app that's tethered to the band, but this is where your scatter plots are located for the v.
19 in the whoa fit app as opposed to the zero nuur Health Pro app, so we've covered overall, A fib we've covered scatter plots. The only thing left, really that you may be looking at discernment on which one to buy would be the ECG charts. Here we go, we have no data here and I cannot activate it from the app to test it on the band directly from here. So for this one I have to put it on actually well, you have to put it on no matter what I should have. These on anyway again this has got the double barrel connection, with the two little pin things here that snap in really holds on easy. I come into here. I touch it to start it, and then I got a slide through it. Then I go into health. Then I slide, then I touch and hold ECG and now it's starting and fortunately this is just a little 30 second test it's going to be faster than if you have the v19. That one is a hundred seconds. It looks like it's gon na take ya over a minute and a half to accumulate a working ECG chart. Good news is it's a really extensive long, robust full chart that your doctor could get a lot out of bad news. Is it takes quite a while of being patient and staying still this one only 30 seconds and that felt like forever right? It says: read the report onto the app and so from here now it's done, but you've got to get it over here.
So you got to get back to your main page scroll down, pull down to cause it to refresh synchronize it and it brings in the data for the ECG. Ok, skipping ahead a little bit it's done now, and it says you can view your ECG and there it is, and I can expand it sideways. We can look at it right here. I can change the characteristics it's really high right now I can go down to in. If you just want the peaks you have quite a bit of control on this one. I can download this whole thing as a PDF. I could send it off to my doctor. It'S got an average 52 beats per minute, heart rate I can come back out of here. I can change the speed of it. We saw all this in the main app I'm not going to belabor it, but all of this stuff is here: you'd hit, save and so forth. You on this one: okay, remember the i7e on this one. I have the artificial intelligence agent that will assess that particular strip of ECG, and it will give me a determination all based on its estimate of what it saw and here I've got something oftentimes. It just says: it's a normal sinus rhythm, but it's also saying I've got atrial premature, beat. I wouldn't know that and I'm not sure what that means. But I take a screenshot of that three fingers on the one 60 and now I could email that to my doctor.
I could take it in on my regular checkup and say: hey doc. My band told me I've got this: could you look into it simple? As that it's just advisory information for your doctor, but it's built into this thing as an artificial, intelligent agent, again it's only for information purposes, I got to continue to emphasize that don't self, diagnose, don't, diagnose yourself as having something and by all means, don't. Diagnose yourself. As being healthy and not having something, which is why I really really get all over the Chinese companies to try to put out ECG, charts and they're fake – and there are some – you got to be careful watch our reviews. Don'T pick those up because it's gon na quote diagnose you as being fine, because it gives you a fine, fake ECG. This does not. This is giving you a real reading. The accuracy and interpretation of that is not you and not me, but it's. A trained professional. Okay, that's this one let's switch to the other one we're on the V 19. Now and if I go into this down to ECG, which is right here, long press and hold – and it says, test it and it's going to go through its overall testing process. But you can't see anything happening so I'm, not gon na. Do it this way it does calculate your heart rate and, if you're out and about and away from everything, then sure you could do that in a pinch, however, it's much more convenient and effective.
If you go into the ECG section here and hit start testing from there now, it's gon na show you your live graph as you do it. I hit start, it says it's testing. All I got to do is make sure I put my finger on here. Watch the diagram, it's testing and it's, showing you the percentage if you notice, they're kicking off at about one a second and so it's a hundred second test there's, the sine wave coming through or sinus wave. You can see. I get double things there. Maybe that was that premature atrial, something rather going on – I don't, know they're all over the place. I'M noisy I'm talking. I can. This is real by wiggling it. The wiggle will show up now because there's a little time delay between the actual testing and the time it gets transmitted and displayed here on the app. But it is really really there. I'M gon na have a really bad reading, because I'm just messing the heck out of it, but just to show you you're getting a lot of information you're getting your average heart rate, this QT interval and heart rate variability, which is all over the board, because you See the distance between the peaks is just jumping I'm, not being still and careful with it. I'Ll go ahead and let it run out to a hundred just so we can see if it's, even gon na accept this. Even though it's continuing to work, I didn't take my finger off long enough to completely upset it and cause it to stop.
I did mess around with it and if it didn't get what it figures as a clean chart, it's going to bounce it and it's gon na say do it over again, and I really like that so you're not gon na be messing around with bogus information, because You didn't do it right. It'S gon na it's gon na only keep what it really likes: okay, we're at 99; 100. It liked it for what it is. I can add a remark on here. I can say, save and now it's there and you actually can play it back and just like this YouTube video, you can scoot it up anywhere. You want, you can scoot it back. You can go to the place where you saw an anomaly. You could, of course take a screenshot of that. Whatever you'd like you can delete it. You get all of this information and it tells you about the medical explanation of each of these. Is that readable? You need it a little bit brighter there you go and the QT interval that's what it's all about that's, the reference range and HRV and so forth. Okay time a start time of end, you could delete the record. You could export it there if you want to there's all the basic stuff you can't change, the height like you can, on the other one or the speed that it grows across the screen, but you have a lot more flexibility in working with it as an actual Living breathing moving ECG chart haha health down here, maintain correct gesture and get ready for tests.
This is the ECG test again fullscreen. I didn't even know that. Look at that Wow, okay, yeah it's, doing the same thing. We just saw only now it's in full screen and it's just about to kick in and there it goes so I can show you what happens if you actually take your finger off long enough. It bounces out of it so it's, really really assessing what's going on. In its environment, when you come back here to this page, the ECG chart is shown right at the very beginning. If you have more than one they accumulate and of course you can go back through previous days to look at ECG charts that you did in the past, like that, one there and so forth. So let's summarize, so these are the two choices right now on the market: the i7e, the v19 a little bit bigger overall screen one button on the front guides you through everything. You got a swipe and touch and do a few more things to get this one to work both of them charged easily. We haven't covered that this one you have to push in on the band to pull it off and you've got your little charging pins that plug right into the USB port. This one a little bit more rough. You got to actually pull it off, comes right off, but same thing, plug it in to charge. It you've seen everything about them now and what they can and can't do they overlap considerably with each other.
They complement each other about 30 bucks each and who knows maybe getting both of them use this one when you're gon na do Fitness uses this one. When you want a big screen to see you're sleeping at night, for your sleep, apnea and all of the all of the other things associated with sleep, really advanced technology, and really really appreciate you sticking with us and watching the comparison of these. To hope to see this technology come out on a lot more devices in the meantime it's out there right now and if you know somebody that's 50 years or older, or if you are yourself, this is worth checking out because it really presents some new information. We haven't had before, especially in the realm of the heart rate variability and the scatter diagrams, that we've been looking at those in and of themselves, are revolutionary new information and it's, something that you can collect night after night, just simply by wearing it and seeing what The results are, in the morning lots of reference material available and down below I'm gon na have article after article after article to dive deeper into what this all is about. So if you really want to get educated on it start there and pick up one of these little things for under 30 bucks to test it all out. You have been watching SmartWatch 6, where a youtube channel on the web at SmartWatch, tix comm. You can get the Bakey v9 teen v 19 from banggood, and you can pick up the alpha wise i7e from gearbest two of our top notch sponsors.
We have links for them both down below and coupon discounts, and please use those if you're going to get them. It helps us out, helps you out. It helps them out.


 featuring the Kospet Optimus 2")

